Objectives
The objectives of this section are:
to introduce tools used for multidimensional data analysis
to explain the basic concepts of OLAP
Outcomes
By the time you have completed this section you will be able to:
define OLAP,
and understand it’s capabilities.
OLAP Cubes
 Dimensions
An OLAP Cube is the key data structure used to ensure multidimensional functionality; it is similar to a table in a traditional database. The key difference is that cubes do not treat all the data the same as tables do but instead have categories of data called dimensions and measures.
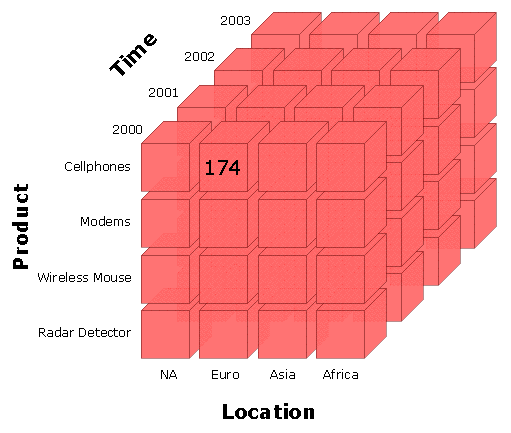
Dimensions are used in OLAP to help simplify the visualization of the dataset. Figure 1 is an example of a data cube for a particular dataset. As one can see this data cube has 3 dimensions namely: time, location and product.
Drilling
Each dimension is a broad group title that allows, you, the user to get a broad sense of the entire dataset. In computer science, one could think of it as a layer of abstraction that hides the details. For instance the time dimension can further be sub-divided into years, quarters, month, weeks; these are levels within the time dimension hierarchy. In order to get a more detailed view, OLAP uses drilling to traverse these various levels of the hierarchy.
Categories
Categories are members of dimensions. A category is basically an item that matches a specific classification. For instance for the time dimension, years is a corresponding category. There is a difference between the levels explained in drilling and the categories discussed here. Levels are the specific name while the categories are the instances in our dataset. For instance, in Figure 1, we have a 2003 category in our dataset but not a 2009 category, yet 2009 is a ‘year’.

