Objectives
The objectives of this section are:
to introduce the basic concepts in data visualizationto explain the various visualization techniques
to understand in which situation a particular technique is used
to introduce higher dimensional visualization techniques that exist
Outcomes
By the time you have completed this section you will be able to:
choose a visualization technique based on the dataset attribute
create a scatter plot, histogram and stem and leaf plot
list common visualization techniques
Visualization Techniques are often specialized to the type of data being analyzed. Broadly visualization techniques can be divided into 3 categories:
- Visualization of small number of attributes
- Visualization of data with spatial/temporal attributes
- Visualization of data with many attributes
Visualizing Small Number of Attributes
When it comes to the visualization of dataset which have a small number of attributes there are various techniques that can be used. Some of these techniques are used for single attributes while others can compare the relationship between two attributes.
Histograms & Stem and Leaf Plots
A histogram is a well known visualization technique that is used for single attributes and as described in the novice level of this section.
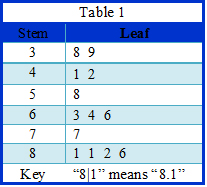
Stem and Leaf Plots- Stem and leaf plots are a type of histogram that can be used to provide insight into the distribution of continuous data. Here each data sample is divided into group with each group containing those values that are the same except for the last digit. Thus each group becomes a stem while the last digits become the leaves. The stems and the leaves are plot vertically and horizontally respectively to obtain a visual representation of the distribution of the data.
Example
Consider the data set below which represents the student scores for a data mining pop quiz.
3.8, 3.9, 4.1, 4.2, 5.8, 6.3, 6.4, 6.6, 7.7, 8.1, 8.1, 8.2, 8.6
The Stem and Leaf Plot is shown below.
Two-dimensional histograms is an extension of the traditional single dimension histogram, it can be used to visual two attributes as opposed to just one. In order to create a 2-D histogram one has to follow the steps used to create a traditional histogram but instead of having x number of bins and having a histogram plot with the same number of columns the number of columns is the number of bins for each attribute multiplied by each other. For instance if for attribute 1 we had three bins and for attribute 2 we have four bins in our resulting 2-D histogram plot we would have 12 columns. The problem with 2-D histograms is that visually it can become complicated and thus defeat the purpose of providing us with relevant comprehensible information.

