Objectives
The objectives of this section are:
to introduce the basic concepts in data visualization
to understand how they impact comprehension of the data
Outcomes
By the time you have completed this section you will be able to:
explain the basic concepts in data visualization
distinguish between representation of different attribute types
Visualization in data mining is not a trivial process and if it isn’t performed correctly can produce erroneous results that could mislead and impede further analysis. This section gives a brief overview of visualization concepts that are critical.
Representation
First step in visualization is mapping the information to a visual format. So taking the data objects and their attributes and the relationships between them and translating this information into a graphical element that could include lines, points, shapes and colors and so on.
The representation of data objects: data objects can be represented based on their attributes’ values if only a single attribute is being considered or they can be represented with the use of rows or columns of a table or as a point in 2D or 3D space.
The representation of attributes: depends on the kind of attribute, ordinal and continuous attributes can be mapped in a similar manner, while categorical attributes require a different form of representation. Nominal attributes are a little bit trickier and require that order not be inferred by the display representation being used.
Arrangement
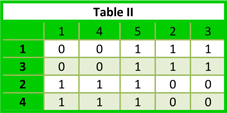
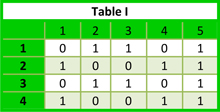
The arrangement of items is crucial; relationships can be deduced from properly arranged visual information. For instance consider the two tables below. The arrangement of the data in chronological order (Table I) shows no relationship but when the rows and columns are permutated as shown in Table II we are able to see a relationship that was previously obscured because of the arrangement. Without even applying any data mining algorithms we are able to realize that half of the objects are positive for the first and fourth attribute and that the other two objects are position for the second and third attributes. We also can see that the fifth attribute is always present for each data object.
Selection
Selection in visualization is as the name suggests, it is the process of selecting a subset of objects and attributes for further analysis while discarding or de-selecting others. This is a vital part of visualization because of the curse of dimensionality. Data objects with only a few attributes can be mapped to a 2D or 3D graphical representation but what if we had data objects with many dimensions? Two problems arise, the first is mapping this information to 2 or 3D becomes cumbersome and the second issue is that mapping it to a higher level is virtually impossible. Another reason why selection is crucial is because of the number of data objects, visualization of a data set with a lot of objects makes the display crowded and thus ineffective in accomplishing the original goal of visualization.

