Objectives
The objectives of this section are:
define density-based clustering
explain the major parts
introduce the DBSCAN algorithm
list the limitations and advantages of this method
Outcomes
By the time you have completed this section you will be able to:
explain the basic DBSCAN algorithm
label points into the appropriate group type
determine which scenarios this algorithm would yield good results.
Definition
DBSCAN is a simple density-based clustering algorithm that aims to discover areas of high density that are separated from each other by areas of low-density. In order to fully understand this algorithm we must first acquaint ourselves with the major aspects of a center-based approach. 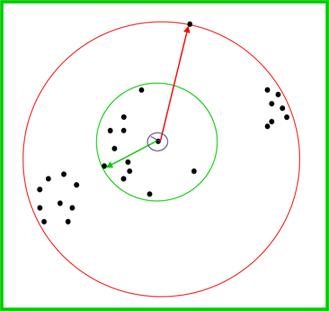
In this approach, density is the number of points within a certain radius. This radius (E) is used to compare points, data points are said to be close enough when the distance between them is less than or equal to E. The size of the radius is crucial because if the radius is too large then all points in the data set will have the same density and if the radius is too small then the density of each data point will be 1.
For instance Figure 1 on the left shows three different radius values that can be used and as one can see when the radius is too small the density is only 1 and when it is too large the density is the number of data points in the data set. The longest radius which is red is too long and as you can see when it is chosen all the points in the data set fall within its boundaries. The purple line represents a small radius whcih is also useless because as you can see the density is one. The green line which represents an acceptable radius seems to be more applicable.
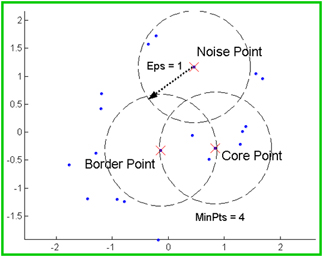
Data points can be classified into three categories
- Core points: these are points that have more than a specified number of points (MinPts) within the chosen radius (E). Graphically speaking, these are points that are in the interior of a cluster.
- Border point: is a point that has fewer than MinPts within the radius (E) but is still in the neighborhood of a core point.
- Noise point: is any point that is neither a core point nor a border point.
Figure 2 is a labeled diagram which shows the classification of certain points.